Google Analytics Adds Drag-and-Drop Dashboards

Google Analytics has a dashboard builder again: a grid canvas inside GA where you drag dimensions and metrics onto cards. Its predecessor, Universal Analytics, had one; GA4 launched without. Google says it is rolling out to all accounts over the coming weeks.
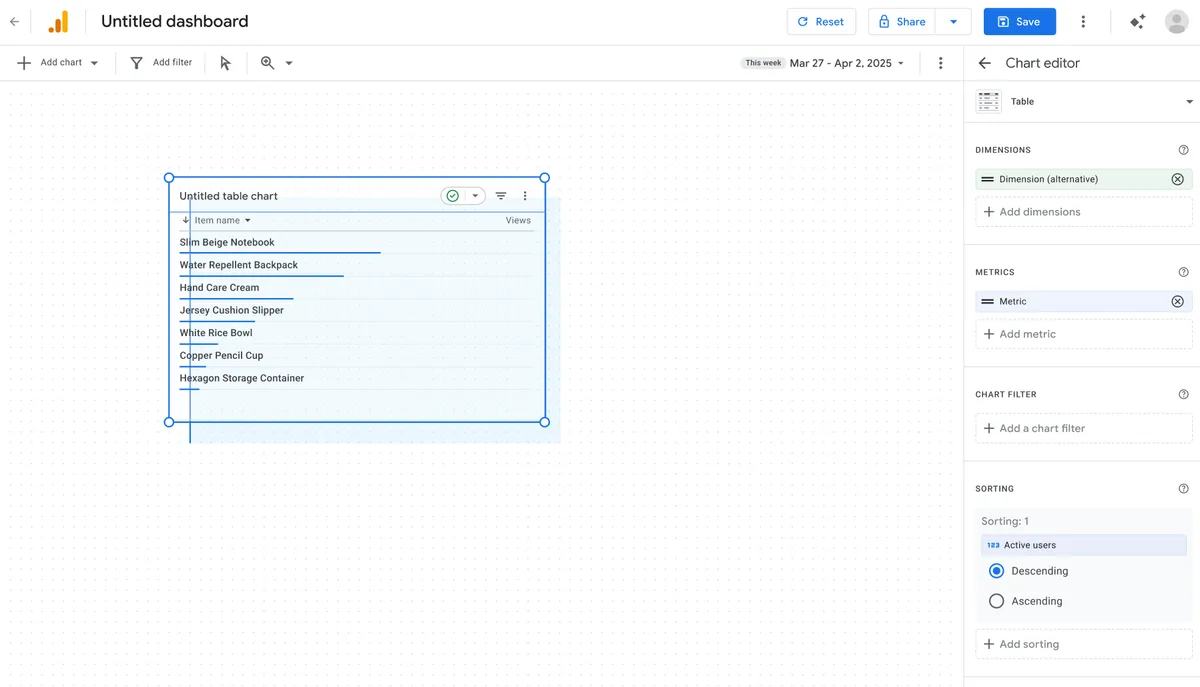
Six card types are supported: scorecards, tables, line, bar, donut and funnel charts. The funnel is the one that changes a habit, because a funnel previously meant opening an Exploration. Saving offers to publish the dashboard straight into the Reports left navigation, without going through Library. Creating one needs Editor or Administrator access; anyone with property access can view what has been published.
The limits decide what you can actually move into it. There is no API support and no segments. Standard properties cap at 15 cards per dashboard and 360 properties at 30, and every published dashboard is shared with the whole property rather than kept to one user.
Sources
More news
-
GoFullPage Removed From Chrome. Prime Suspect: Pac-Man.
GoFullPage was pulled from the Chrome Web Store over a copyright issue. We compared the old build with its replacement. Exactly one asset didn't make it.
-
Microsoft Clarity splits AI citation queries into branded and non-branded
Microsoft Clarity now labels AI citation queries as branded or non-branded and splits Share of authority by the two. What the split is actually good for.
-
OpenAI Retires ChatGPT Atlas, Folding Agentic Browsing Into ChatGPT
OpenAI is shutting down ChatGPT Atlas on 9 August 2026, under 10 months after launch, and moving browser-based agentic work into ChatGPT and Codex.